DAVP’s ad politics--Express loses, Pioneer gains
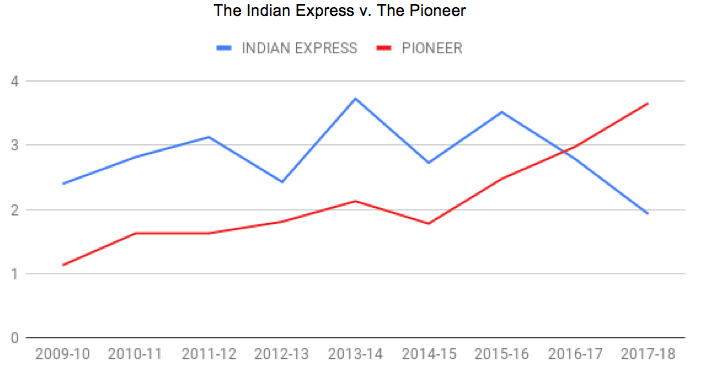
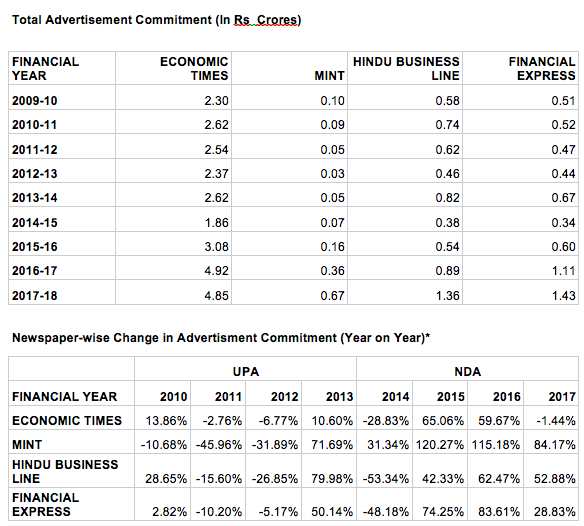
As the National Democratic Alliance government ramps up its publicity in the build up to the 2019 Lok Sabha polls, it is choosing the media outlets it advertises in to suit its self-interest. And the most conspicuous casualty of this approach is the Indian Express. Not the group, but the paper. Because its sister publication, the Financial Express has not seen similar cuts. In fact, starting from financial year 2015-16 to 2017-18 FE has received more advertising than the Hindu Business Line. Perhaps its editorial policy does not displease the government as much.
The United Progressive Alliance government allocated a higher advertising budget to English newspapers. The data in this report has been obtained through RTI for a period covering two central governments: 2009-10 to 2017-18.
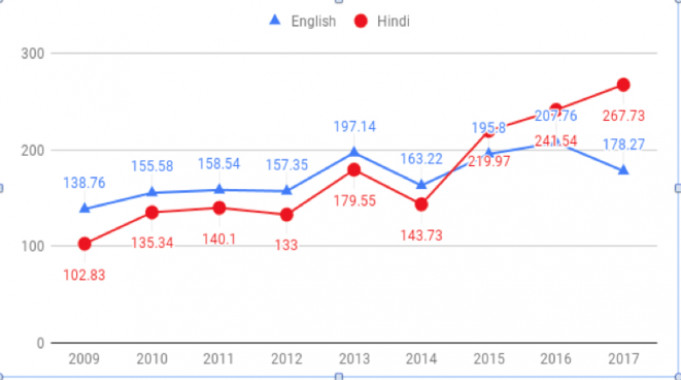
Overall, government advertising routed through the Directorate of Advertising and Publicity in leading English newspapers came down in 2017-18, compared to the previous year. The government spent a total of Rs 178.2 crore on this segment in the latest year. The previous year it was Rs 207.7 crore. (Table 1)
TABLE 1
Print media commitment for English Ads
during FY 2009-2010 to 2017-2018
|
FINANCIAL YEAR |
COMMITMENT |
|
2009 |
1387643523 |
|
2010 |
1555859293 |
|
2011 |
1585448790 |
|
2012 |
1573575038 |
|
2013 |
1971459470 |
|
2014 |
1632227071 |
|
2015 |
1958066441 |
|
2016 |
2077622274 |
|
2017 |
1782711073 |
However there was no cut in total allocations to Hindi newspapers. The ad spend rose from 241 crore to 267 crore in 2017-18.
TABLE 2
PRINT MEDIA COMMITMENT FOR HINDI LANGUAGE
DURING FY 2009-2010 TO 2017-2018
|
FINANCIAL YEAR |
COMMITMENT |
|
2009 |
1028316417 |
|
2010 |
1353475547 |
|
2011 |
1401020307 |
|
2012 |
1330060866 |
|
2013 |
1795586388 |
|
2014 |
1437337868 |
|
2015 |
2199730433 |
|
2016 |
2415456780 |
|
2017 |
2677322444 |
The papers which saw cuts in their share of advertising in 2017-18 were the Times of India (37 pc), The Hindustan Times (20 pc) , and The Indian Express (30 pc). The Hindu did not see a reduction in government advertising in 2017-18, and nor did the Pioneer.
TABLE 3
ENGLISH NEWSPAPERS
Total Advertisement Commitment (In Rs Crores)
|
FINANCIAL YEAR |
TIMES OF INDIA |
HINDUSTAN TIMES |
THE HINDU |
INDIAN EXPRESS |
PIONEER |
|
2009-10 |
34.19 |
24.67 |
9.30 |
2.40 |
1.13 |
|
2010-11 |
41.37 |
28.25 |
9.74 |
2.82 |
1.63 |
|
2011-12 |
43.74 |
30.64 |
9.72 |
3.13 |
1.63 |
|
2012-13 |
42.64 |
30.15 |
10.10 |
2.43 |
1.81 |
|
2013-14 |
49.57 |
37.75 |
14.35 |
3.73 |
2.13 |
|
2014-15 |
47.34 |
34.50 |
9.98 |
2.73 |
1.78 |
|
2015-16 |
54.74 |
43.47 |
11.27 |
3.52 |
2.48 |
|
2016-17 |
63.07 |
45.76 |
13.35 |
2.79 |
2.98 |
|
2017-18 |
39.74 |
36.46 |
14.41 |
1.93 |
3.66 |
The Directorate of Advertising and Visual Publicity has varying ad rates for different papers, circulation is ostensibly the main measure in allocating a paper a rate on the basis of which advertising is given. Some newspapers are not audited for circulation by the Audit Bureau of Circulation. The Express Group is not enlisted with ABC, nor is a paper like Mint. So the basis on which a rate is accepted for a paper is often not transparent.
DAVP uses three criteria for determining circulation—ABC figures, a chartered accountant’s certificate produced by the paper to certify circulation, and also some figures that the Registrar of Newspapers (RNI) puts out. And how does DAVP verify the claims made by a CA certificate? Does it ask for proof of newsprint consumption? It does not.
The system used by DAVP to allocate advertising at certain rates is a software called Enterprise Resource Programme. Which will produce figures based on what is fed into it. Oral instructions for political reasons influence the backend feeding in, as it were, so do newspaper agents who lobby aggressively with the Directorate, according to DAVP sources. The instructions regarding individual papers are never put down in a file in writing.
The advertising given to the Indian Express peaked during the tenure of the UPA government. However, even the UPA cut advertising to it in 2012-13, in the aftermath of the 2G scam. The Pioneer has become a bigger beneficiary during the NDA's tenure. The number of editions of each paper has remained constant during most of this period: Nine editions for the Indian Express and ten for The Pioneer.

TABLE 4
Total Advertisement Commitment to Delhi Edition of English papers
(In Rs Crores)
|
|
UPA |
NDA |
|||||||
|
FINANCIAL YEAR |
2009 |
2010 |
2011 |
2012 |
2013 |
2014 |
2015 |
2016 |
2017 |
|
TIMES OF INDIA |
21.04 |
25.83 |
26.71 |
27.78 |
30.53 |
27.72 |
31.58 |
32.30 |
20.5 |
|
HINDUSTAN TIMES |
22.89 |
25.67 |
27.86 |
27.9 |
32.85 |
31.05 |
38.84 |
41.18 |
31.81 |
|
HINDU |
0.68 |
0.79 |
0.69 |
0.75 |
1.29 |
0.74 |
0.77 |
0.92 |
1.7 |
|
INDIAN EXPRESS |
1.02 |
1.29 |
1.59 |
1.34 |
1.82 |
1.45 |
1.8 |
1.43 |
0.91 |
|
PIONEER |
0.57 |
0.61 |
0.68 |
0.78 |
0.96 |
0.77 |
0.89 |
1.48 |
1.82 |
TABLE 5
HINDI NEWSPAPERS
Total Advertisement Commitment (In Rs Crores)
|
|
UPA |
NDA |
|||||||
|
FINANCIAL YEAR |
2009 |
2010 |
2011 |
2012 |
2013 |
2014 |
2015 |
2016 |
2017 |
|
AMAR UJALA |
4.89 |
6.40 |
5.62 |
4.31 |
6.71 |
5.11 |
8.80 |
13.76 |
18.65 |
|
DAINIK BHASKAR |
9.95 |
10.98 |
10.78 |
10.49 |
15.82 |
13.32 |
15.69 |
20.16 |
21.38 |
|
DAINIK JAGRAN |
11.64 |
14.54 |
14.85 |
14.75 |
19.12 |
17.54 |
24.74 |
33.40 |
36.64 |
|
RAJASTHAN PATRIKA |
4.70 |
5.01 |
4.99 |
5.04 |
8.37 |
6.12 |
7.94 |
7.43 |
10.14 |
|
HINDUSTAN |
6.34 |
8.52 |
8.88 |
8.18 |
12.18 |
9.80 |
13.54 |
16.48 |
19.24 |
|
NAVBHARAT TIMES |
4.81 |
6.1 |
6.21 |
6.52 |
9.54 |
8.66 |
10.88 |
13.94 |
11.80 |
TABLE 6
Newspaper-wise % Increase (Year on Year)
|
|
UPA |
NDA |
||||||
|
FINANCIAL YEAR |
2010 |
2011 |
2012 |
2013 |
2014 |
2015 |
2016 |
2017 |
|
TIMES OF INDIA |
20.99% |
5.72% |
-2.52% |
16.26% |
-4.51% |
15.63% |
15.22% |
-36.98% |
|
HINDUSTAN TIMES |
14.52% |
8.44% |
-1.59% |
25.20% |
-8.62% |
26.00% |
5.27% |
-20.33% |
|
HINDU |
4.70% |
-0.23% |
3.90% |
42.03% |
-30.42% |
12.93% |
18.46% |
7.93% |
|
INDIAN EXPRESS |
17.14% |
11.18% |
-22.33% |
53.27% |
-26.79% |
29.12% |
-20.77% |
-30.67% |
|
PIONEER |
43.80% |
-0.06% |
11.41% |
17.61% |
-16.32% |
38.92% |
19.93% |
23.07% |
|
AMAR UJALA |
30.82% |
-12.22% |
-23.39% |
55.86% |
-23.91% |
72.33% |
56.35% |
35.52% |
|
DAINIK BHASKAR |
10.39% |
-1.81% |
-2.74% |
50.84% |
-15.79% |
17.79% |
28.47% |
6.07% |
|
DAINIK JAGRAN |
24.95% |
2.16% |
-0.73% |
29.67% |
-8.29% |
41.05% |
35.00% |
9.70% |
|
RAJ. PATRIKA |
6.64% |
-0.41% |
1.04% |
66.05% |
-26.95% |
29.83% |
-6.47% |
36.49% |
|
HINDUSTAN |
34.40% |
4.16% |
-7.82% |
48.86% |
-19.53% |
38.15% |
21.66% |
16.73% |
|
NAVBHARAT TIMES |
26.50% |
1.93% |
5.09% |
46.22% |
-9.20% |
25.62% |
28.10% |
-15.37% |
The Indian Express is the only newspaper to see a decrease in government advertising two years running.
TABLE 7
FINANCIAL NEWSPAPERS OF THE SAME GROUPS

In 2017-18 financial papers saw no cuts in advertising except for a marginal decrease in the allocation for the Economic Times.
More analysis of advertising trends to follow.


