DAVP’s advertisement allocation politics –II
Print advertisement trends for financial years 2009-10 to 2017-18
In July we looked at how the Directorate of Advertising and Visual Publicity has been allocating advertising to national newspapers. This second article looks at some interesting trends regarding allocations to regional newspapers. We looked at DAVP’s ad commitment to 21 leading regional newspapers across seven languages.
The sample pertains to expenditure incurred from 2009-10 till 2017-18, which broadly reflects the full-tenure of UPA-II and the first four years of the incumbent government.
Broad Picture
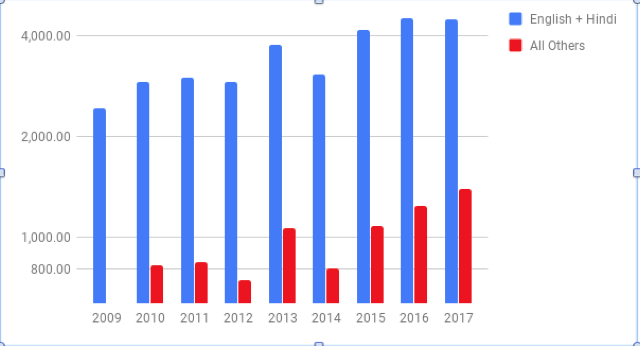
UPA-II and NDA-II increased their advertising commitment to regional newspapers after one year in office (FY 2010-11 and FY 2015-16). Both FYs saw an increased expenditure of over 30% from the previous FYs. As with English and Hindi dailies, the election year (FY 2013-14, represented as 2013 in visual below) has seen a surge in ad allocations. If this trend holds good, we can safely expect more advertising in regional newspapers in coming months as NDA-II gears up towards the General Elections early next year.
Advertisement allocations in the UPA II and NDA II years in Rs crore
|
FY |
2009 |
2010 |
2011 |
2012 |
2013 |
2014 |
2015 |
2016 |
2017 |
|
National |
241.6 |
290.9 |
298.6 |
290.3 |
376.7 |
306.9 |
415.7 |
449.3 |
446 |
|
Regional |
63 |
81.9 |
83.7 |
74.2 |
106.4 |
80.2 |
107.8 |
123.3 |
139.3 |
Maharashtra and Gujarat
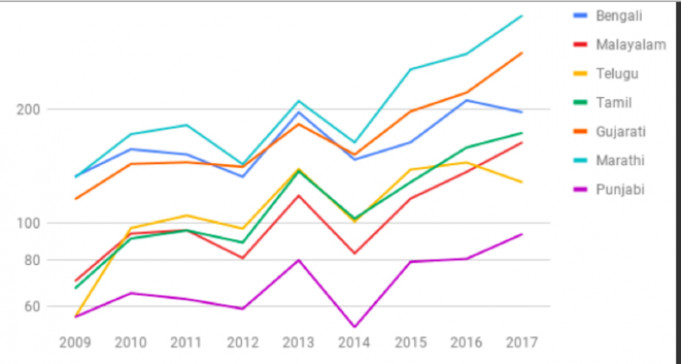
Across the 7 major regional languages, Marathi newspapers received the highest ad commitment in both UPA-II and NDA-II. But the allocations to Gujarati newspapers is most striking in both the regimes. UPA-II spent about 14.1 crores in 2012-13, almost in equal measure to Marathi newspapers (about 14.3 crores). The elections to Gujarat’s State Assembly in 2012 perhaps explains this massive increase.
On the other hand, the ad commitments to Gujarati newspapers under the current NDA-II has seen a steep increase. In the previous FY (2017-18) especially – which saw elections to Gujarat’s State Assembly – the ad commitments increased more than 27% in comparison to preceding FY. More interestingly, the annual expenditure of Gujarati newspapers in NDA-II exceeded Bengali newspapers, while this trend was other way around in UPA-II. The reasons are intriguing when one compares the demographic data of West Bengal which has more than 9 crore population as compared to 6 crore in Gujarat.
The figures for FY 2016-17 and FY 2017-18 also reveal what could be a politically significant trend. The total expenditure on Bengali and Telugu newspapers saw a dip, while all remaining regional newspapers saw a moderate-to-steep surge.
Southern story
NDA-II has steadily increased ads in Tamil and Malayalam newspapers – and have exceeded the expenditure in Telugu newspars. Last FY (2017-18), in fact, saw a sharp dip in ad commitment to Telugu newspapers.
Table 1: Total print advertisement commitment (in Rs Crores) in various regional languages
|
|
UPA |
NDA |
|||||||
|
FY |
2009 |
2010 |
2011 |
2012 |
2013 |
2014 |
2015 |
2016 |
2017 |
|
Bengali |
13.27 |
15.68 |
15.2 |
13.26 |
19.65 |
14.7 |
16.36 |
21.13 |
19.65 |
|
Malayalam |
7 |
9.38 |
9.5 |
8.07 |
11.8 |
8.3 |
11.6 |
13.66 |
16.36 |
|
Telugu |
5.62 |
9.7 |
10.46 |
9.6 |
13.9 |
10.09 |
13.8 |
14.46 |
12.82 |
|
Tamil |
6.70 |
9.1 |
9.56 |
8.9 |
13.7 |
10.27 |
12.83 |
15.8 |
17.34 |
|
Gujarati |
11.55 |
14.3 |
14.5 |
14.1 |
18.3 |
15.2 |
19.75 |
22.1 |
28.3 |
|
Marathi |
13.19 |
17.2 |
18.17 |
14.3 |
21.05 |
16.35 |
25.5 |
28.06 |
35.5 |
|
Punjabi |
5.63 |
6.5 |
6.3 |
5.9 |
7.97 |
5.3 |
7.9 |
8.04 |
9.35 |
National v. Regional
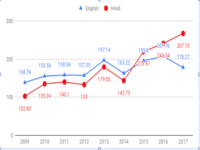
As reported earlier, the UPA-II gave priority to English newspapers. On the other hand, the NDA-II increased ad commitment to Hindi newspapers to exceed English newspapers. Total ads spent on regional dailies (w.r.t. 7 major languages) by both governments is at a ratio of 79:21 when compared to ads spent on Hindi and English newspapers.

The 7 major Hindi dailies (namely Amar Ujala, Dainik Bhaskar, Dainik Jagran, Rajasthan Patrika, Hindustan, Navbharat Times andJansatta) in FY 2017 received around 118 crores (more than 50% of total ad commitment to Hindi newspapers). In contrast, the total ads spent in Telugu, Tamil and Malayam dailies has not exceeded 50 crores in FY 2017.
UPA-II and NDA -II increased their ad spend for print media in the year following the election by 22..4 % in 2010 and by 35 % in 2015. The spread of ad spend between National and regional however remained in the same proportion as in the election year ; 78 % ( English and Hindi) and nearly 22% ( Regional) in 2010 and 79.5 % ( English and Hindi) and 20.5% (Regional) in 2015.The spend on English and Hindi and other regional papers was increasing. However what is interesting to see is that in 2014, the total Print ad spend fell drastically by nearly 20% as compared to 2013. Was it because of the emphasis on ad spots on television and radio and other modes of publicity just before the Elections by UPA _II? ( Reply to Starred Question No 102, in Rajya Sabha on 5.5.2017 Mr Arun Jaitley has stated that the spend on print media during the FY 2014-15 was Rs 424.84 crores while it was RS 473.67 crores for Electronic media.
In 2016 and 2017 there has been increase in ad spend for print media and the overall spend of DAVP for publicity has also increased to Rs 1160.16 crore in 2015-16 ( RS unstarred question 550 answered on 23.7.2018) and Rs 1264 .26 crore in 2016-17 and 1313.57 crore in 2017-18. The trend is definitely towards increasing publicity spend by the Government.
Fine print
The ad commitment to Bengal’s leading newspaper - ABP –has seen a massive cut last year (more than 43% from the previous year). Up until 2016-17, the ad commitment to ABP was roughly around 40% (lowest at 37% FY 2015-16) of total ads appearing in Bengali dailies. However, there was a spurt in ad spend to ABP in 2016 (an election year) by 66.45% (for its previous year) and accounted for 48% of ads spend amongst Bengali dailies. The reasons for the sharp drop in 2017-18 is unclear.
Table 2: Analysis of total ads commitment (in Rs Crores) for ABP and Bengali newspapers
|
FY |
2009 |
2010 |
2011 |
2012 |
2013 |
2014 |
2015 |
2016 |
2017 |
|
ABP (In Crores) |
6.01 |
6.87 |
6.23 |
5.81 |
7.91 |
6.77 |
6.1 |
10.14 |
5.76 |
|
% Change |
|
14.2 |
-9.34 |
-6.71 |
36.12 |
-14.43 |
-10.01 |
66.45 |
-43.2 |
|
All Bengali (In Crores) |
13.27 |
15.68 |
15.2 |
13.26 |
19.65 |
14.7 |
16.36 |
21.13 |
19.65 |
|
% Share |
45.33 |
43.81 |
41.00 |
43.83 |
40.26 |
45.97 |
37.25 |
47.99 |
29.31 |
Tamil Press
Thanthi and Dinamalar, two major regional dailies in Tamil Nadu, have seen sharp changes to their ad commitment. A massive surge in the case of Dinamalar and a steep fall for Thanthi. The figures from last FY (2017-18) reveal a cut of almost 30% to Thanthi and upswing of 58% for Dinamalar. The gap in ad revenue between the two newspapers has come down heavily.
The reasons are quite puzzling especially one looks at the circulation figures as reported in Regularity Report for 2017. Dinamalar has claimed circulation of 7.9 lakh copies while Thanthi has asserted circulation figure of more than 15 lakhs.
Table 3: Analysis of ad commitments (in Crores) for Thanthi and Dinamalar
|
FY |
2009 |
2010 |
2011 |
2012 |
2013 |
2014 |
2015 |
2016 |
2017 |
|
THANTHI |
2.46 |
3.5 |
3.7 |
4 |
6.3 |
4.9 |
5.9 |
7.2 |
5 |
|
% Increase |
42.65 |
7.36 |
6.97 |
57.4 |
-21.9 |
20.45 |
20.8 |
-30.04 |
|
|
% Share |
36.78 |
38.68 |
39.51 |
45.50 |
46.38 |
48.35 |
46.64 |
45.63 |
29.18 |
|
DINAMALAR |
0.9 |
1 |
0.41 |
0.36 |
0.75 |
1.17 |
1.8 |
2.7 |
4.2 |
|
% Increase |
13.33 |
-59.30 |
-13.81 |
108.84 |
55.85 |
56.43 |
46.95 |
58.23 |
|
|
% Share |
13.55 |
11.32 |
4.38 |
4.07 |
5.50 |
11.44 |
14.33 |
17.05 |
24.66 |
Sai Vinod is a lawyer and researcher.


